Monitoring
Monitoring
Access AWS CloudWatch
- Select All alarms
- You will see 1 alarm appear (after 2-3 minutes from the first backup).
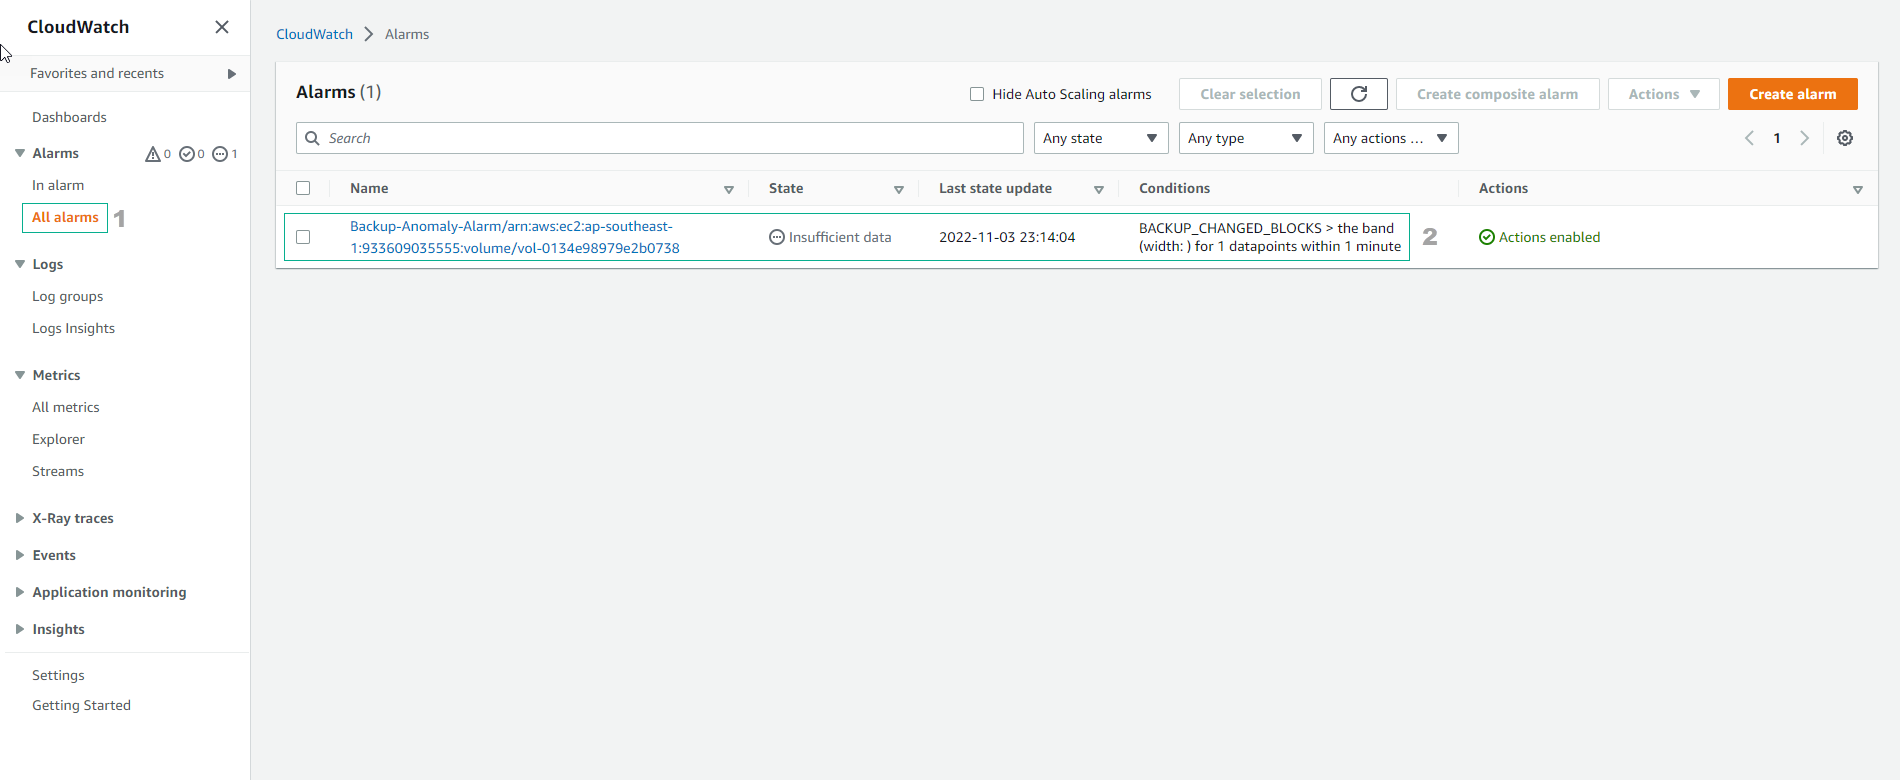
This alarm was created by the AWS Lambda function we deployed. It is configured to detect anomalies based on the custom metrics of Amazon CloudWatch pushed during subsequent backups.
- Select the alarm that appears to view the detailed parameters.
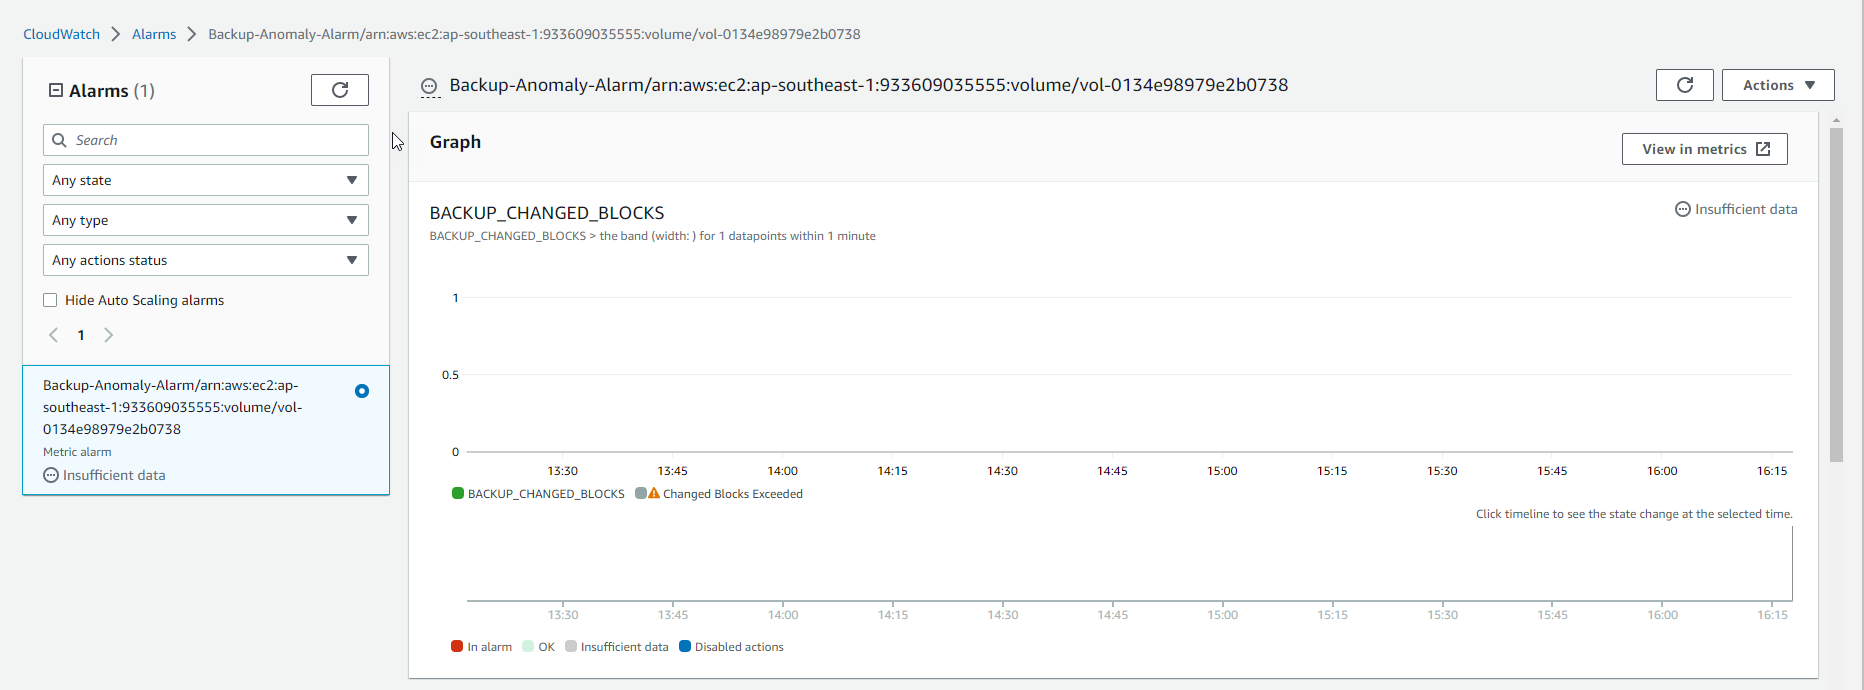
- At this point, we do not have any metric data, so the alarm will display the status of Insufficient data. In fact, to properly train the Amazon CloudWatch anomaly detection model, we will need to go through quite a few backup cycles before a pattern can be established.
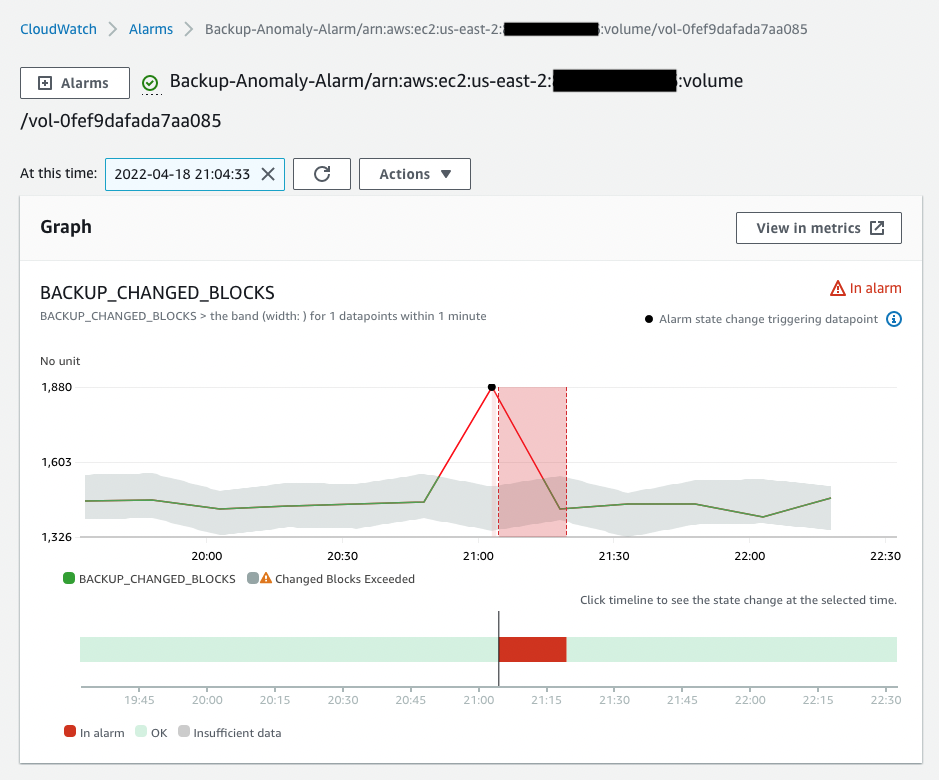
- If you check back when a significant number of backups have occurred, you will notice a gray band stretching across the chart. This is the anomaly detection band. When the current and previous snapshots are compared, if too many blocks have changed causing the value to breach the threshold of the gray band, the alarm will be triggered.
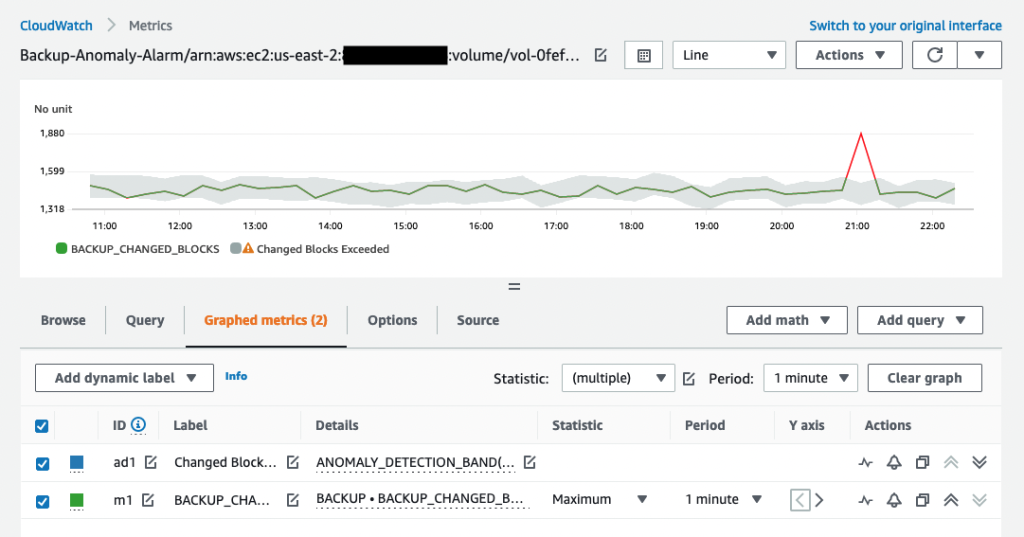
- Finally, let’s take a look at the actual custom metric on Amazon CloudWatch. If you click the View in metrics button in the upper right corner of the chart, you will be redirected to the metrics page, where you can see all the data points of the metric, as well as its anomaly detection configuration.